
On Market Volatility
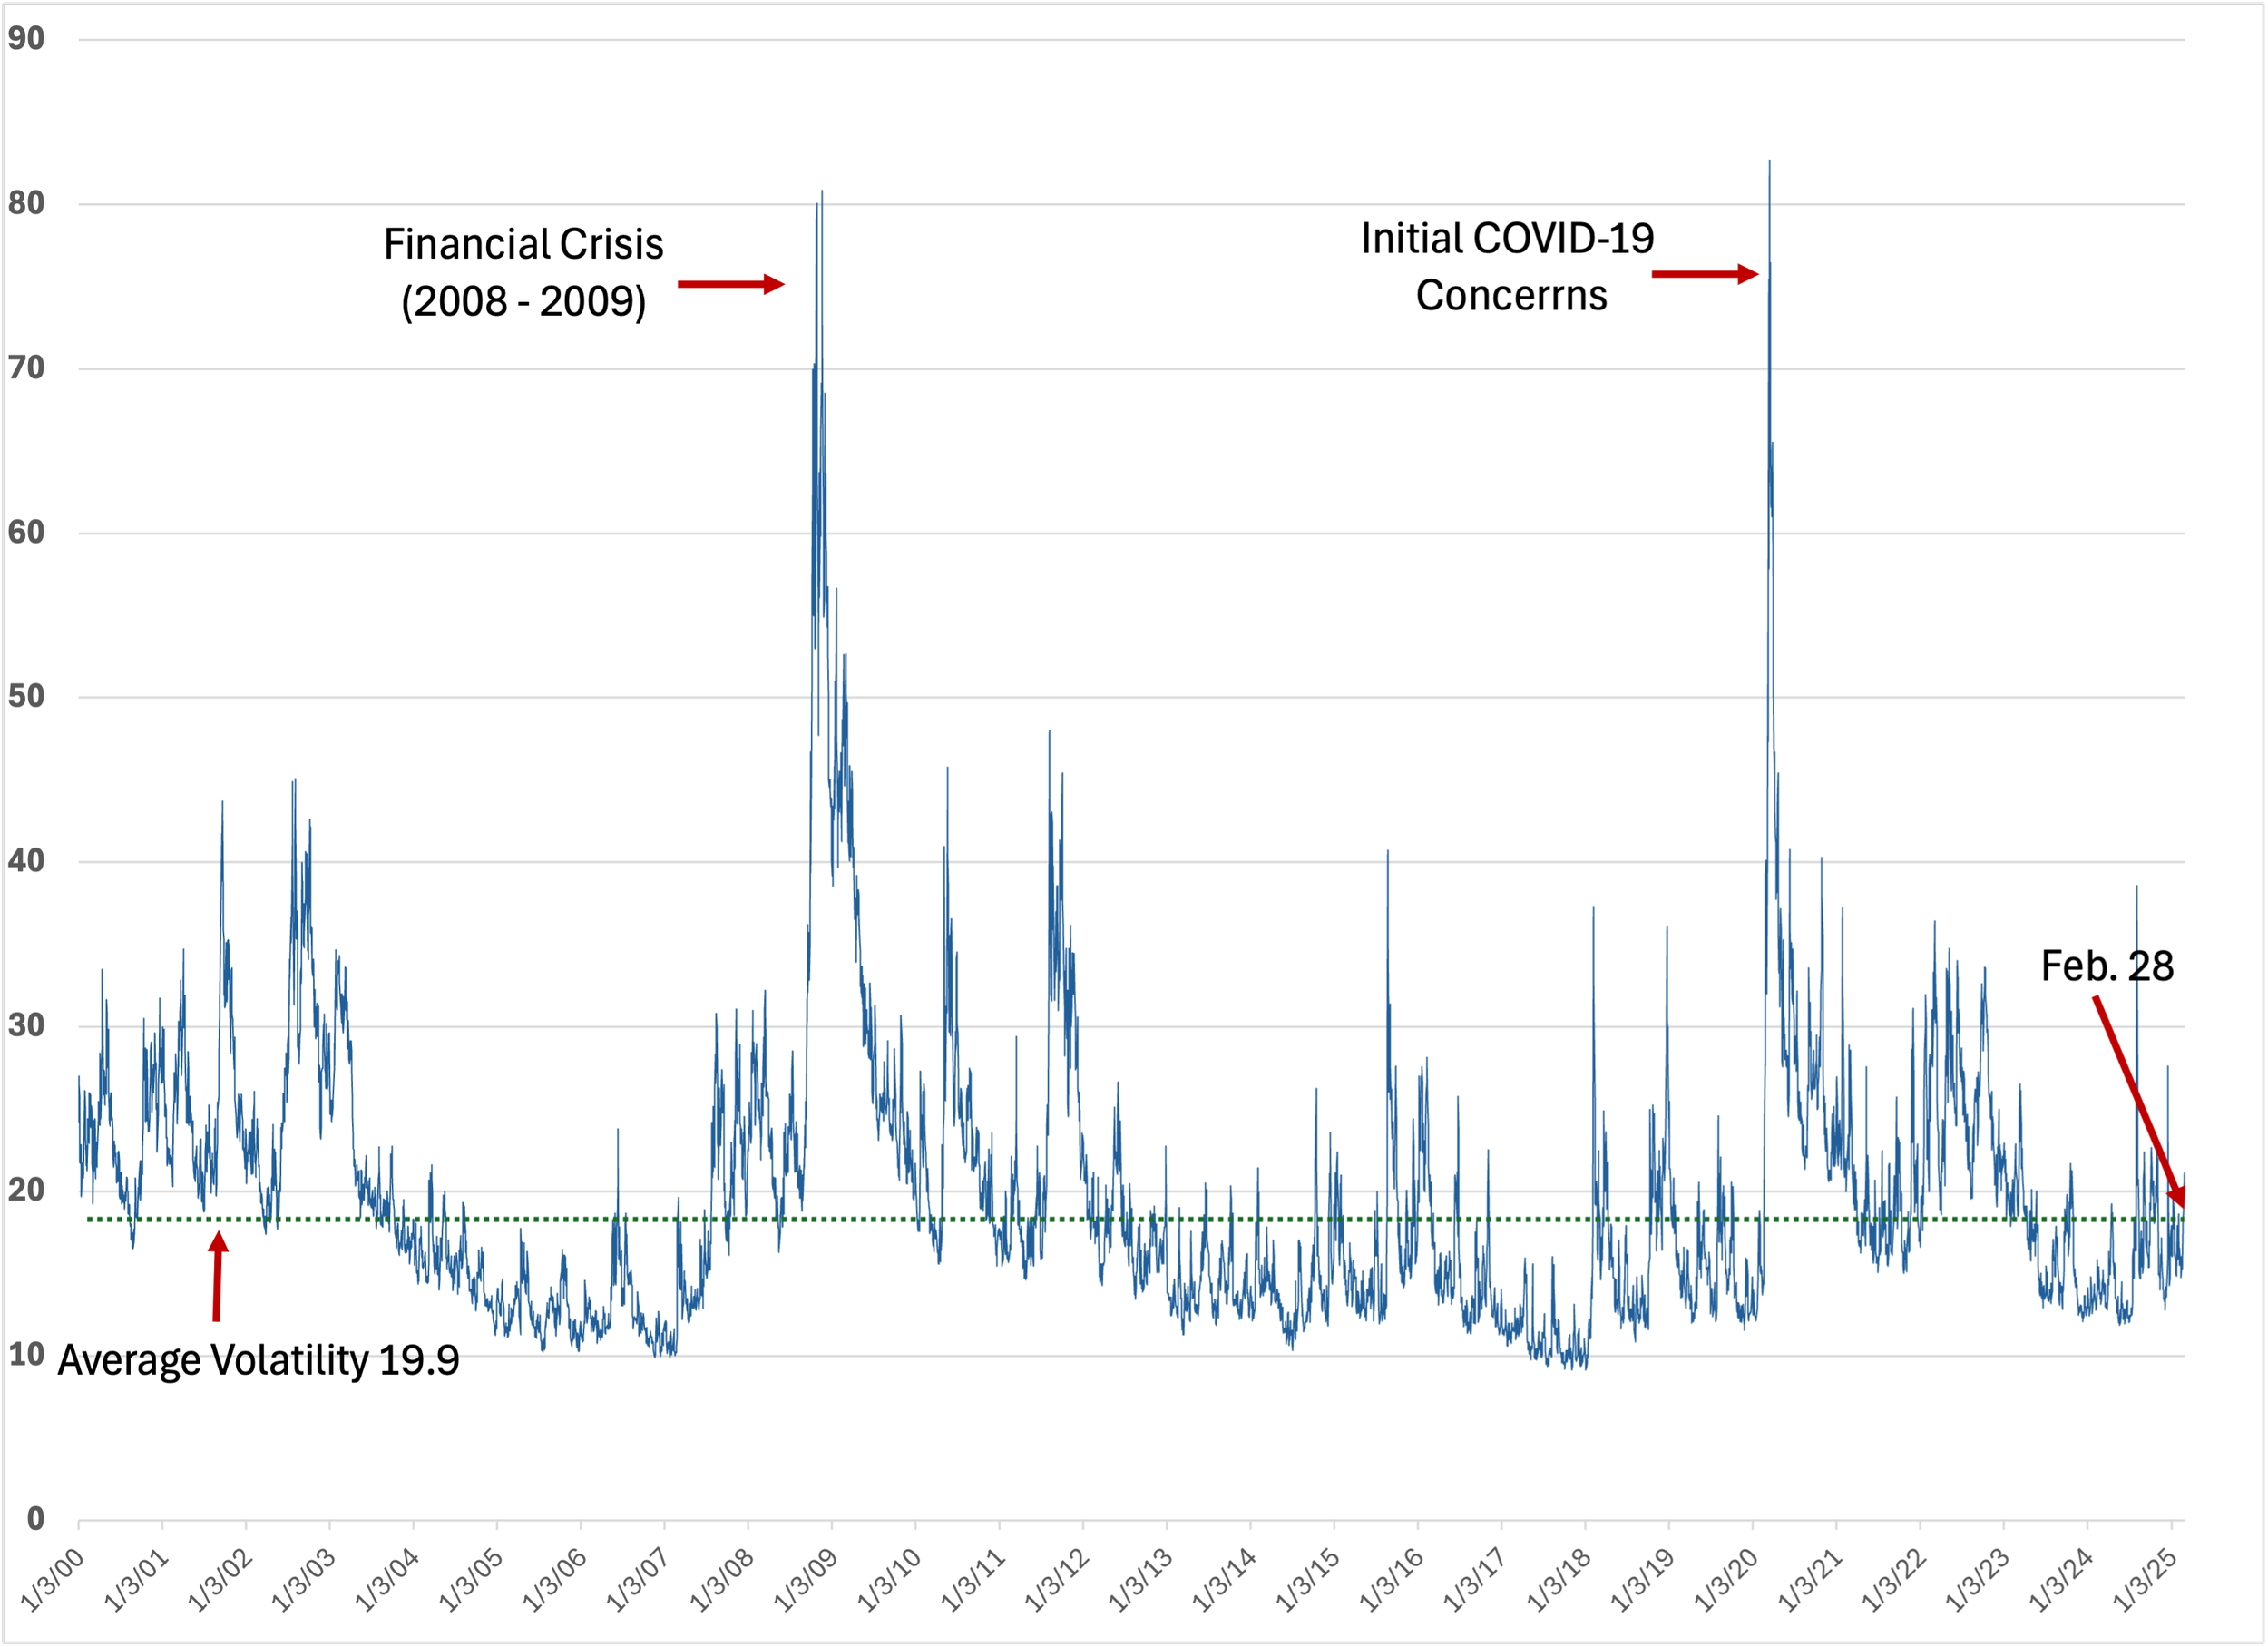
Last week, as global markets experienced broad swings, the S&P 500 volatility index (VIX) rose above 21—suggesting stress, but finished the week at 19.6. With the potential for market volatility increasing, the following are presented below: 1) chart of VIX index from January 2000 to present, 2) drivers of market volatility, 3) current volatility factors, 4) measuring volatility and 5) interpreting VIX levels.
S&P 500 Volatility (VIX): January 2000 to present
Drivers of Market Volatility: Market volatility is influenced by diverse factors including macroeconomic conditions, geopolitical events, corporate earnings reports, and shifting investor sentiment. Trading dynamics, including algorithmic strategies and high-frequency trading, can amplify short-term fluctuations, while heightened fear and uncertainty can drive volatility higher.
Current Volatility Factors: Relevant factors include 1) U.S. tariffs on EU imports, with the potential for a trade war; 2) tariffs on key trade partners, including: 10% tariff on Chinese imports, 25% tariff on imports from Canada and Mexico (effective April 2025); 25% tariff on global steel and aluminum imports; 3) anticipated U.S. Federal Reserve interest rate cuts, 4) declining consumer confidence and 5) rising competition from Chinese AI firms.
Measuring Volatility: The VIX Index, a key measure of S&P 500 market volatility, is often called the "fear gauge." A rising VIX signals increasing uncertainty and risk aversion, while a declining VIX suggests market stability and investor confidence.
Interpreting VIX Levels: VIX levels offer a sliding scale of market sentiment. Below 15: suggests complacency. 15-20 indicates normal market conditions, 20-30 signals rising uncertainty; 30-40 reflects market stress; above 40 marks crisis conditions.